Customer Service: How to Anticipate a Surge in Demand
By TIS Consulting Group

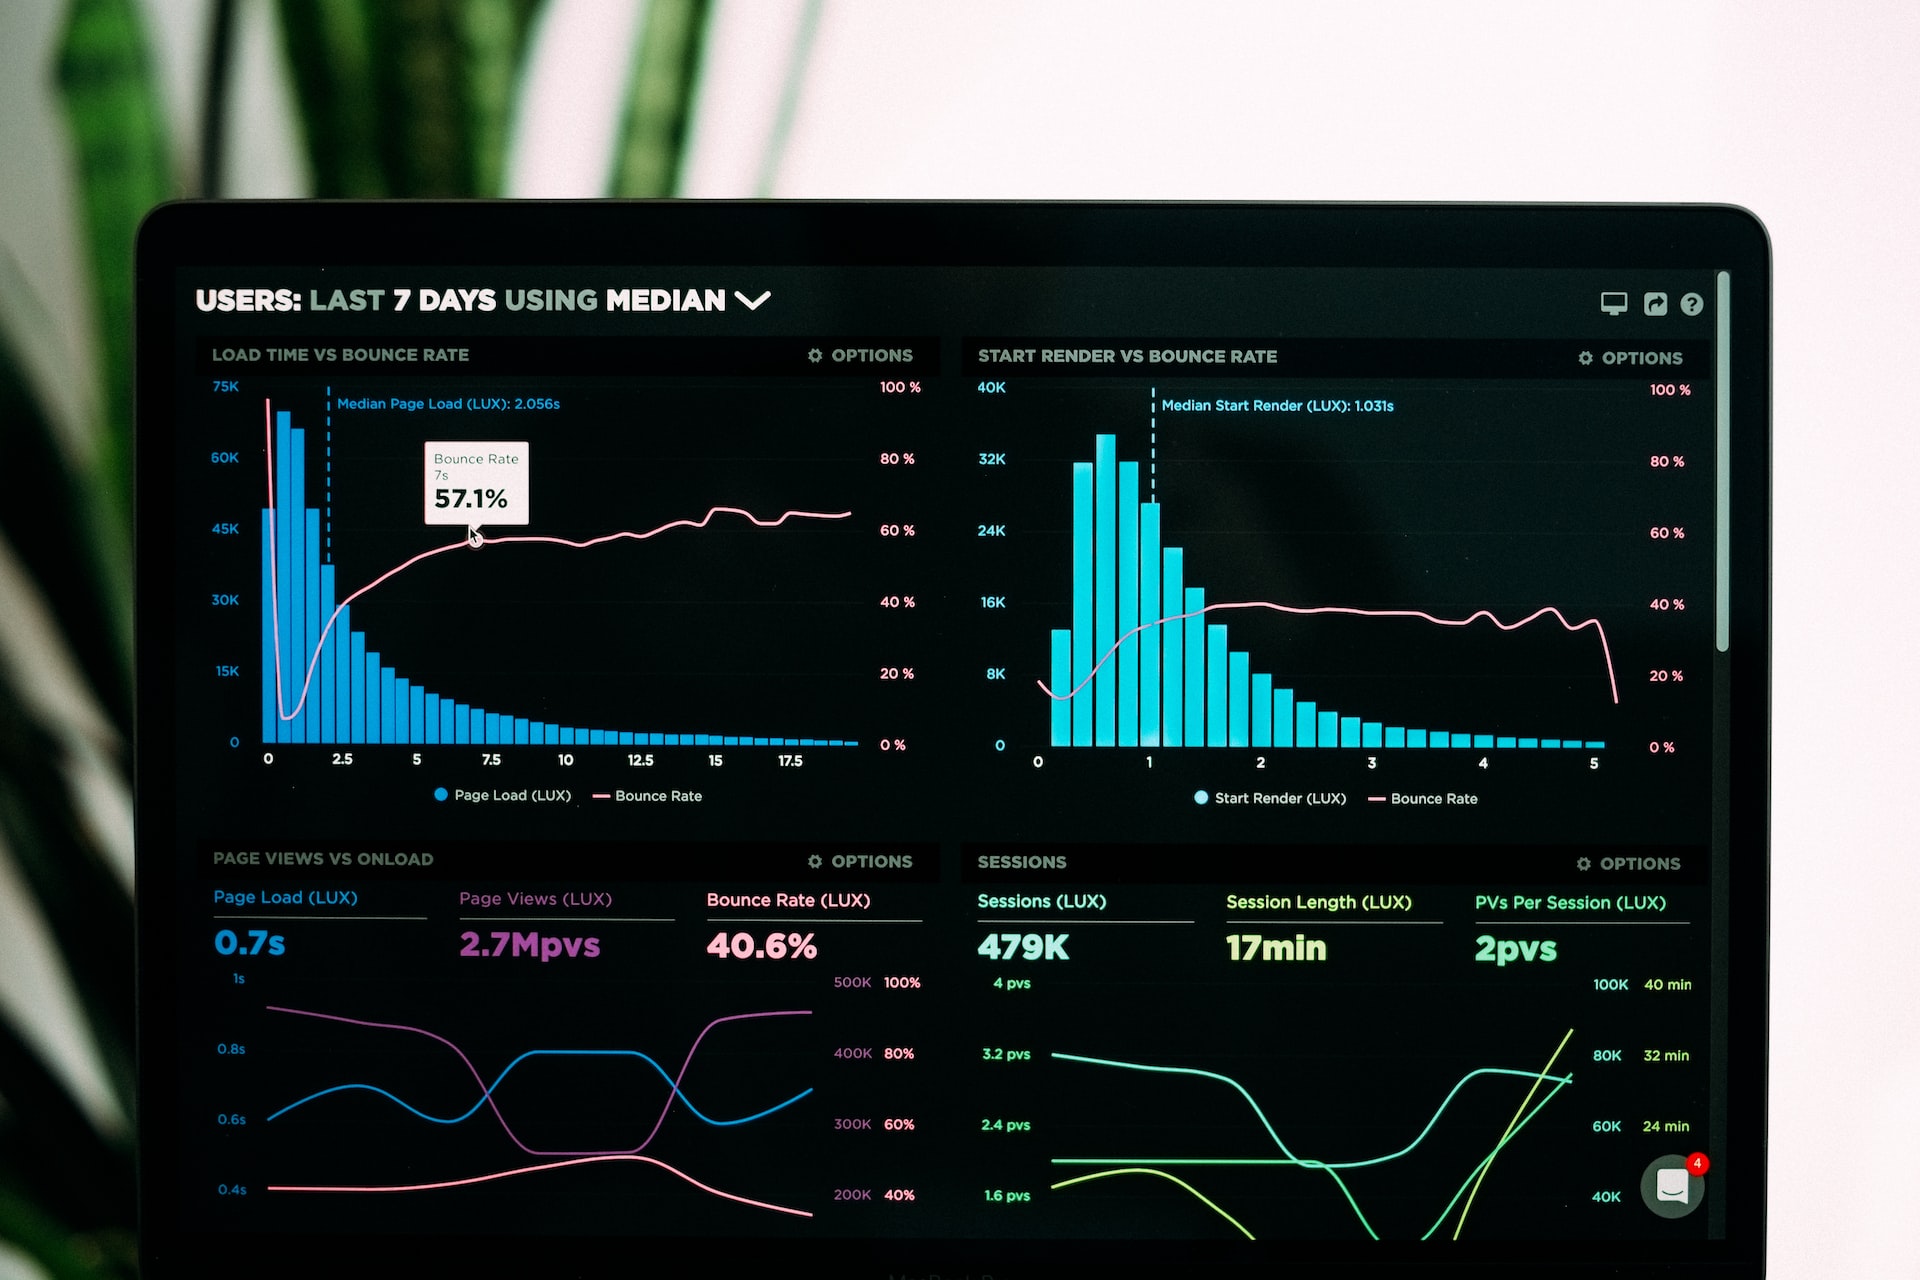
As previously mentioned in the Key Performance Indicator (KPI) publication, a way to graphically visualize these KPIs is using a Balanced Scorecard.


.jpg)